


Zakura Desk Signal
The terminal's engine on your own chart — same SuperTrend, same six-vote confidence, same entry and stop, one codebase.
How it works
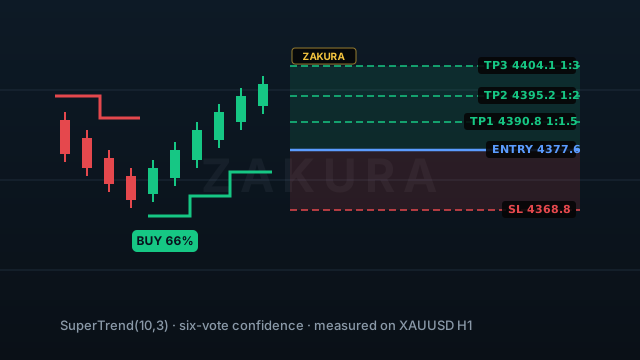
SuperTrend(10,3) — Wilder ATR bands that only ever ratchet toward price. The line under price is the stop a trader is actually holding; the flip is the event.
On every flip, three checks vote: the SuperTrend itself, an RSI band that treats overbought-in-an-uptrend as a warning, and MACD momentum. Confidence is the share that agree — and a fresh flip is discounted ×0.8, because an untested band is the least reliable part of a trend.
Below 50% confidence there is no signal. And if the first target (1.5R) needs a bigger move than the last 100 bars have covered, the setup is STRETCHED and withdrawn — not dressed up with a flattering ratio.
A qualified signal draws the Zakura position zone: risk shaded red from entry to the SuperTrend stop, reward shaded green to TP3, with TP1/TP2/TP3 at 1.5R / 2R / 3R. The terminal prices its targets on the next structure swing instead, so the zones there are the same shape at different distances.
Features
- The exact engine behind zakurafx.com's terminal — one codebase, one answer
- Six-vote confidence score on every flip
- Zakura position zones: entry, SL, TP1–TP3 with R:R tags
- Fresh-flip discount and reachability filter (honesty rules, not options)
- Desk panel: verdict, votes, levels, stretched warning
- BUY / SELL alerts on bar close
- Invite-only TradingView script — access granted to PRO members
Key settings
| Input | Meaning |
|---|---|
| SuperTrend period / multiplier | The desk runs 10 / 3.0 — change only to experiment |
| Reachability window | Bars the top target is judged reachable against (100) |
| Zone width | How far right the position zone extends (16 bars) |
Simulated 3-Month Curve
Simulation — not a trade record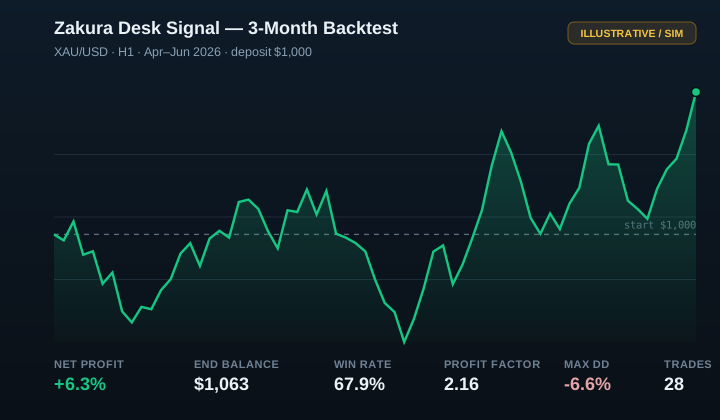
⚠️ Win rate, profit factor and trade count are the engine's real measured backtest on XAUUSD M15 (Aug 2025 – Aug 2026, 151 signals in the New York session, and only the flips that cleared the desk's own confidence floor — lib/xauusd-profile.json; the live record on this site keeps scoring them forward). The equity curve is an illustration drawn to those stats. M15 is the timeframe the desk alerts on because it is the one that measured best: the same rules came out at 50.5% (PF 1.24) on H1 and 46.4% (PF 0.94) on M5.
Illustrative/simulated backtest on XAU/USD M15 over ~3 months (Apr–Jun 2026), $1,000 deposit. For demonstration only — past performance does not guarantee future results, and live results differ due to spread, slippage and news. Trading FX/CFDs carries a high risk of loss.