


កំពុងផ្ទុក…
កំពុងផ្ទុក…
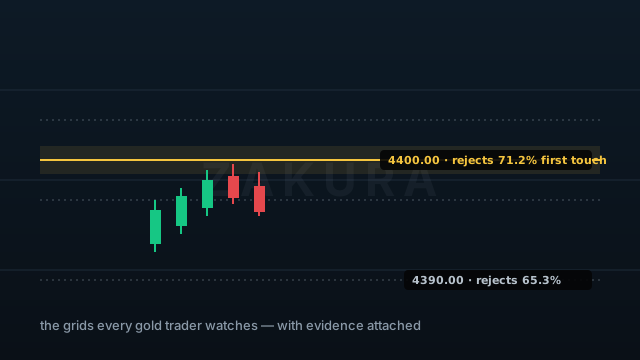
The $10 minor and $50 major grids around price — the levels every gold trader watches, drawn so you never type them again.
The nearest level above and below price gets a ±0.3×ATR14 test zone — the trainer's own definition of "at the level", so the chart and the desk's statistics mean the same thing.
First approaches to the $10 grid rejected 70.6% of the time over the trained window; the $50 grid 74.6%. Those rates ride on the nearest levels, on the chart, at the moment they matter.
One alert when price enters a test zone — the moment the measured statistic becomes tradeable.
| Input | Meaning |
|---|---|
| Minor / major grid ($) | XAUUSD: 10 and 50 |
| Rejection % | The measured defaults — update from each profile release |
| Levels each side | How much grid to draw (4) |