

How it works
Every bar in range distributes its volume across the price rows it touched — three modes, from fast (close-only) to OHLC-weighted, which concentrates volume around each bar's typical price. Auto-zoom reads whatever your chart shows; fixed lookback pins the window.
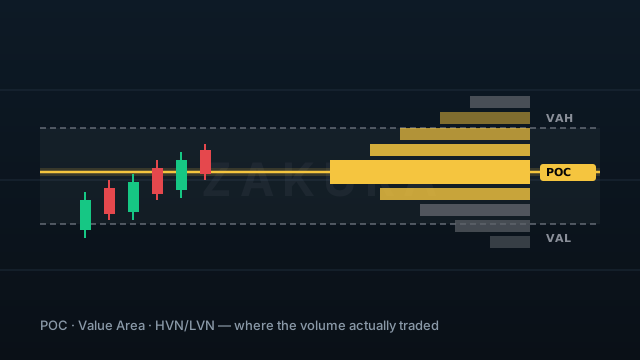
The row that traded the most volume is the Point of Control — the fairest price of the window, drawn with a gold glow and optionally smoothed over a few bars so it does not flicker between neighbouring rows.
The rows around the POC holding 70% of the traded volume. Price inside it is at accepted value; price outside it is an auction looking for acceptance — the panel says which, live.
HVN rows (heavy volume) act as magnets and support; LVN rows (thin volume) are the air pockets price crosses fast. Both optional, both drawn from the same measured rows.
Features
- Auto-zoom visible-range engine or fixed lookback
- Three volume-distribution modes (close-only / spread / OHLC-weighted)
- POC with gold glow + optional smoothing
- Value Area (VAH/VAL) with shading, price tags
- HVN / LVN node lines
- Zakura panel: POC, VAH, VAL, zone, total volume
- Alerts: POC cross, VAH breakout, VAL breakdown, VA re-entry
- Invite-only TradingView script — PRO members
Key settings
| Input | Meaning |
|---|---|
| Calculation range | Visible Range (auto-zoom) or Fixed Lookback bars |
| Rows / Value Area % | Profile resolution (24) and VA coverage (70%) |
| Distribution mode | How each bar's volume spreads across rows |
| Placement & width | Right or left, % of range, padding from price |
| Theme | Dark or light chart, Zakura Gold / Bright Yellow / Amber |